Business Analysis of Web Application Information
Gain Insight into Your Web Application’s Data through MySQL and Microsoft Excel
Data Integration: An Important Reporting Tool
Businesses often use a collection of independently developed applications, with vendor-supplied database layouts. In order to understand the big picture of the business it is important to pull information from multiple sources into a flexible analytical tool. One such tool is the ubiquitous spreadsheet application, such as Microsoft Excel, that is capable of pulling information from multiple sources and performing various analytical reporting functions.
Given that many people already have the skills necessary to work with data once it has been pulled into a common spreadsheet application, the spreadsheet’s external data features can be readily used to make up-to-date, read-only copies of operational data into various worksheets. Business managers can then freely review, analyze, and make charts on the data without interfering with original applications or dealing with the hindrance of re-entering data from printed reports.
Web Application: Big Pool of Data to Understand
Web applications are delivered to users from a web server over a network such as the internet or an intranet. They are frequently employed by businesses as the web browser allows a single interface to function across multiple operating systems, such as Windows, Mac OS X, and Linux. Web applications are used to implement web mail, online retail sales, online auctions, customer billing systems, and perform many other functions. Very often web applications store information in a relational database system, such as MySQL, Microsoft SQL Server, or Oracle.
One common business web application is an on-line billing system to allow customers to visit a web site to review, print, and pay invoices. The information managed by this type of application is important to the business that will want to generate financial reports such as the number of sales receipts, outstanding invoices, and etcetera. While many of these basic reports will be available as part of the application itself, it may be important to integrate other data, such as expenses associated with accounts, from outside of the particular web application. Fortunately, the relational database servers, such as MySQL, used by the most common web applications, can be accessed across an intranet or the internet by data-aware applications on a personal computer.
The Spreadsheet: The Hidden Power Tool
Spreadsheets, such as Microsoft Excel, Gnumeric, Lotus 1-2-3, and Open Office Calc, are good for analyzing data and have numerous computation, statistical, and graphing capabilities. A spreadsheet program lets you enter text, numbers, or formulas in a network of cells so that, by changing the content of certain cells, you can automatically perform an involved set of calculations and update various graphs [1]. Microsoft Excel calls an individual spreadsheet a worksheet and a collection of worksheets forms a workbook.
Spreadsheets are a versatile utility for data analysis and business modeling [2] and, more importantly, are able to pull information from multiple sources, validate data, use hundreds of statistical analysis functions, and use numerous graphing functions. With regard to the on-line billing web application introduced earlier, the spreadsheet is the ideal tool to allow financial planners to interact with a copy of the invoice data.
Lazy Typist: Avoid Data Re-Entry with ODBC

Figure 1. Windows’ ODBC source admin (background) and MySQL Connector dialog configure a data source to be later used from within the spreadsheet.
Manually re-entering information is a time-intensive process prone to errors. It is better to automatically pull the information from the primary source. Microsoft Excel is easily programmed to copy data into a worksheet from a SQL database through an Open Database Connectivity (ODBC) driver.
Like many web applications, the on-line billing program stores its data in a MySQL database. Whereas Windows does not come pre-packaged with the MySQL Connector for ODBC, it can be obtained free-of-charge from MySQL, AB, at www.mysql.com/products/connector/odbc. Once the driver is installed an ODBC data source is easily created through the Windows Control Panel.
The External Data sources feature of Microsoft Excel is accessed through the ‘External Data’ command bar and the ‘Import External Data’ submenu under the ‘Data’ menu. A worksheet is easily linked to a SQL database source by choosing the ‘New Database Query’ command and entering the desired SQL query. Excel will continue update the worksheet whenever new data is found in the database and update various cell calculations and graphs accordingly.
Data Souffle: Chopping up Your Information
One of the first tasks for effective analysis of information is to break up the task into one or more parts. When working with data from another application the first task is often to pick what you want to look at and then plug that data into the spreadsheet. While there are many ways to place data into particular cells on certain sheets, one natural way to break up the data is to have one or more worksheets functioning as independent tables. Some worksheets can be designed to automatically poll a particular ODBC source for data and others can be intended for direct manipulation by the spreadsheet user. Summary worksheets can then use the built-in charting and statistical functions to pull information from the various other sheets.
Structured Query Language (SQL) Requests
SQL is a tool for organizing, managing, and retrieving information stored in a relational database management system
[3]. Beyond basic data retrieval, SQL allows the user to manipulate data from one or more tables and columns into a new table, which can easily be linked to a worksheet in a spreadsheet application. Consider the following code example that pulls some information from a client invoice table, renaming several fields and converting the internal date to a particular format:
SELECT
 FROM_UNIXTIME(date_paid, '%m/%d/%Y') AS `Date`,
 client_id AS `Acct No.`,
 amount_paid AS Amount,
 id AS `Invoice No.`
FROM client_invoice
WHERE date_paid > 0
 AND FROM_UNIXTIME(date_paid, '%Y') = '2004'
ORDER BY date_paid
This particular query is designed for the MySQL database server, making use of the ability to have field names with internal white space, but the basics apply to other SQL servers as well.
The SELECT section specifies which fields to be retrieved and how to format the data, the FROM section specifies the table (or tables in some cases) from which the data is pulled, and the WHERE section specifies the constraints for the lookup. This particular query only pulls records where a positive amount has been paid in the year 2004. Finally the ORDER BY parameter specifies that the results be sorted by the date paid. The first few records of the data set will look something like the following:
| `Date` | `Acct No.` | Amount | `Invoice No.` |
| 01/01/2004 | 54 | $25.00 | 175 |
| 01/01/2004 | 13 | $15.00 | 9 |
| 01/09/2004 | 3 | $30.00 | 2 |
| 01/15/2004 | 7 | $50.00 | 14 |
| 02/01/2004 | 54 | $25.00 | 176 |
| 02/01/2004 | 13 | $15.00 | 10 |
| 02/15/2004 | 7 | $50.00 | 15 |
Once a worksheet has been populated with the results of the SQL query, the user is free to manipulate the data using various spreadsheet functions, including applying currency symbols, without affecting the actual operating data from which the results were derived.
Apply Formulas to Cells and Ranges
Once worksheets have been configured to either pull data from external data sources and, perhaps, some through direct manual entry, the spreadsheet can be configured to perform various calculations. Spreadsheet applications support hundreds of statistical and arithmetic functions. These can be used to calculate totals for particular columns, find the mean and standard deviation for data, and much more.
The built in functions can be used to combine data from multiple worksheets, for example the formula
'=AVERAGE(Recurring!C:C,Income!B:B)'
will take the average value of the C column from the ‘Recurring’ worksheet and B column from the ‘Income’ worksheet. Many more advanced functions are available and even useful capabilities, such as Pivot Tables, which are not necessarily a database feature, can be used.
| Customer Receipts Statistics | |
| Number of Receipts | 20 |
| Average | $76.59 |
| Min | $4.84 |
| Max | $570.00 |
| Median | $50.00 |
Artist: Pivot Tables, Charts, and More
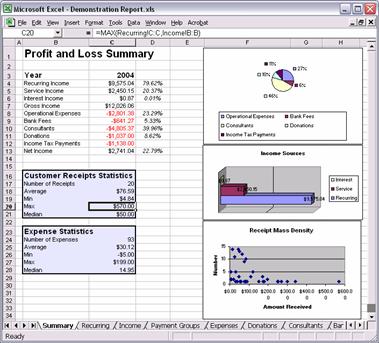
Figure 3. This example pulls data from various worksheets and produces graphic summaries. The statistics on the left-hand-side of the report are computed using Excel functions.
The summary worksheet pulls data from the Recurring, Income, Expenses, Donations, Consultants, Bank Fees, and Income Tax tables. Some of the registers are updated real-time from the database servers and others, such as Income Tax are entered directly into Microsoft Excel.
Moreover, the user is able to combine the advanced capabilities of the spreadsheet application with database queries to make up new charts. For example, a user could wish to make a scatter plot of payment receipts by amount called a “Receipt Mass Density” chart. Such a graph can be easily made with a simple SQL query to pull a data table from the database and then using the chart wizard to plot a scatter plot with the resulting X and Y values.
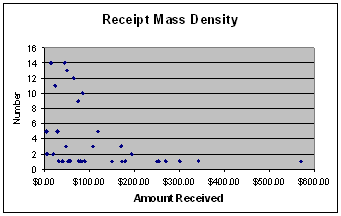
Figure 4. The receipt mass density is a simple scatter plot from data in the "Payment Groups"
worksheet. It quickly shows the nature and size of payments received from customers. The point values
are computed by SQL making use of the COUNT and GROUP BY database functions.
Conclusions
With the modern prevalence of off-the-shelf software being mixed with in-house developments, it is as important as ever for business managers to have access to operational and financial reports that integrate information from multiple sources. Spreadsheets provide a convenient tool for this important task as they can quickly pull data from multiple sources and allow the business managers to experiment with information and even make up unique charts without the need to directly manipulate the business’s database server or servers. Moreover, a savvy spreadsheet user does not have to be an expert programmer or web developer in order to work with the information once it has been retrieved from the primary source.
References
- Williams, G. Lotus Development Corporation’s 1-2-3. 1982 [cited November 20, 2005]; A fast, versatile package that combines spreadsheet, graphing, and database functions (Reprinted from Byte, issue 12/1982, pp. 182-198.)]. Available from: The WayBack Machine.
- Winston, W.L., Microsoft Excel Data Analysis and Business Modeling. 2004: Microsoft Press. 624.
- James R. Groff, P.N.W., SQL: The Complete Reference. 1st Edition ed. 1999, Berkeley, California: McGraw-Hill Osborne Media. 994.